
![]() I recently started looking into ways of monitoring the temperature and humidity in my garage - for two reasons. Firstly, I have my lab workload cluster out there in the form of a Dell C6100, and I’ve noticed with the recent weather that the temperature in there gets…a bit warm. Secondly, I like to brew beer at home, and one of the keys to a good brew is consistent temperature!
I recently started looking into ways of monitoring the temperature and humidity in my garage - for two reasons. Firstly, I have my lab workload cluster out there in the form of a Dell C6100, and I’ve noticed with the recent weather that the temperature in there gets…a bit warm. Secondly, I like to brew beer at home, and one of the keys to a good brew is consistent temperature!
I also want to kick the tyres with some new skills - Python, InfluxDB and Grafana all seem pretty useful skills to acquire.
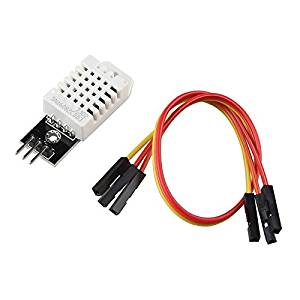
Thanks to Datrium sponsoring the vExpert programme I have a Raspberry Pi 3 lying around at home doing nothing, so I did some reseach and ordered an inexpensive (£6) temperature and humidity sensor, the AM2302, which is based on the DHT22, but with a resistor and pins pre-wired:
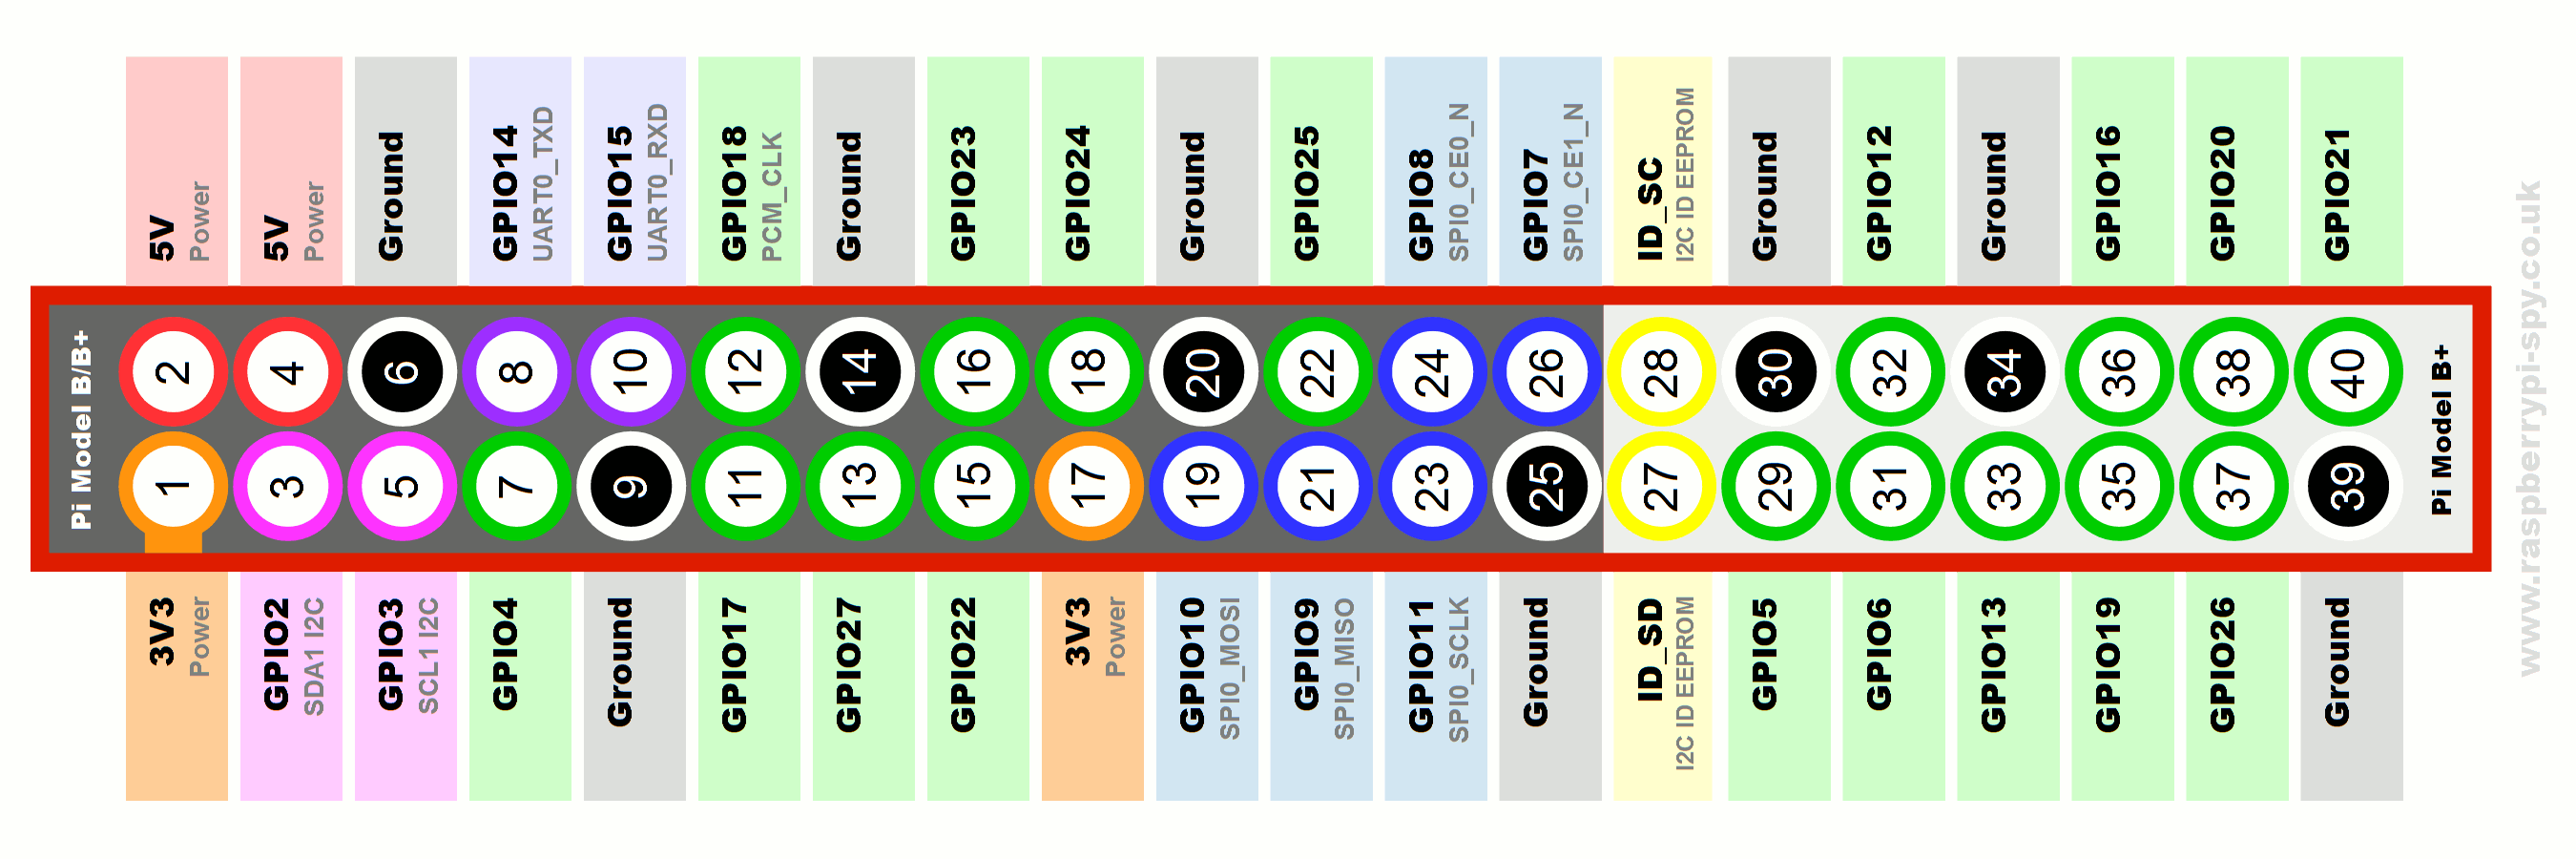
Connecting the three pins to the GPIO on the Pi is simple using a map of the Raspberry Pi, I used:
- Pin 1 - 3.3v power (+)
- Pin 7 - GPIO one-wire data out
- Pin 9 - Ground (-)
Note the gpio # you connect to for later - I’m using gpio 4.
With everything connected, I powered on my Pi and proceeded to the installation. I have the latest Raspbian deployed freshly, with all software and firmware updates installed:
sudo apt-get update && sudo apt-get upgrade -y
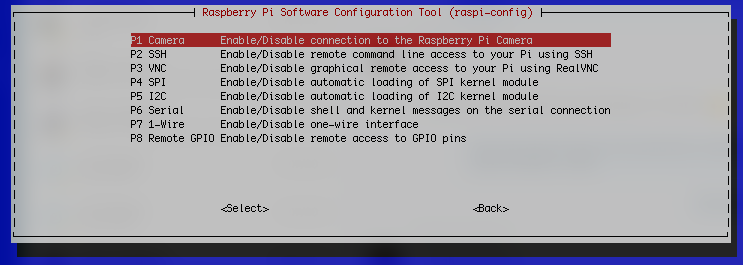
sudo rpi-updateFirstly, because I’m using the Raspberry Pi 3 on the latest Raspbian, I need to make sure the gpio driver module is loaded on boot. To do this I ran sudo raspi-config and selected “Interfacing Options” to enable SPI, I2C and 1-Wire. Reboot the Pi.
Next I needed a Python library to deal with reading the sensor data. Fortunately there’s already an excellent library freely available, the Adafruit_DHT library. The following commands install the pre-requisites (which may already be installed), clones the Adafruit_DHT library from GitHub, then runs the installer:
sudo apt-get install build-essential python-dev python-openssl -y
git clone https://github.com/adafruit/Adafruit_Python_DHT.git
cd Adafruit_Python_DHT
sudo python setup.py install
Nothing much to see there! But, all being well, we can now query the sensor using the example script with two argumets - 22 (for the DHT22 driver) and 4 (to use gpio 4):
sudo python Adafruit_Python_DHT/examples/AdafruitDHT.py 22 4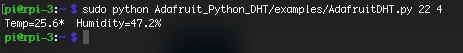
And with that success, I moved onto installing InfluxDB. Since the Pi boots from an SD card, and I don’t really want to be writing lots of data to an SD card (with questionable endurance), I am going to install InfluxDB and Grafana on my Intel NUC, which is running Ubuntu 18.04.
I added the InfluxDB source to my apt repository by creating a new repository file, installing the public key, updating apt-get and then installing influxdb:
echo "deb https://repos.influxdata.com/ubuntu bionic stable" | sudo tee /etc/apt/sources.list.d/influxdb.list
sudo curl -sL https://repos.influxdata.com/influxdb.key | sudo apt-key add -
sudo apt-get update
sudo apt-get install influxdb -y
sudo systemctl start influxd
sudo systemctl enable influxd
I enable authentication for InfluxDB by because by default it’s wide open, and I’m nervous about that! Editing sudo systemctl restart influxd
Now using theinflux command we can start issuing influx SQL-like commands - create a new database, create an admin user and grant admin rights, create a user for the Pi and grant read/write rights, and create a read only user for Grafana.
create database "sensor_data"
create user "admin" with password "influxadmin"
grant all privileges to admin
create user "rpi-3" with password "rpi-3"
grant all on "sensor_data" to "rpi-3"
create user "grafana" with password "grafana"
grant read on "sensor_data" to "grafana"
Let’s get some data going into the InfluxDB, back on the Pi I create a new folder “sensor_data” and edit a new python script - sudo pip install influxdb
import time
import sys
import datetime
import Adafruit_DHT
from influxdb import InfluxDBClient

# Configure InfluxDB connection variables
host = "192.168.6.11" # My Ubuntu NUC
port = 8086 # default port
user = "rpi-3" # the user/password created for the pi, with write access
password = "rpi-3"
dbname = "sensor_data" # the database we created earlier
interval = 60 # Sample period in seconds

# Create the InfluxDB client object
client = InfluxDBClient(host, port, user, password, dbname)

# Enter the sensor details
sensor = Adafruit_DHT.DHT22
sensor_gpio = 4

# think of measurement as a SQL table, it's not...but...
measurement = "rpi-dht22"
# location will be used as a grouping tag later
location = "office"

# Run until you get a ctrl^c
try:
    while True:
        # Read the sensor using the configured driver and gpio
        humidity, temperature = Adafruit_DHT.read_retry(sensor, sensor_gpio)
        iso = time.ctime()
        # Print for debugging, uncomment the below line
        # print("[%s] Temp: %s, Humidity: %s" % (iso, temperature, humidity))
        # Create the JSON data structure
        data = [
        {
          "measurement": measurement,
              "tags": {
                  "location": location,
              },
              "time": iso,
              "fields": {
                  "temperature" : temperature,
                  "humidity": humidity
              }
          }
        ]
        # Send the JSON data to InfluxDB
        client.write_points(data)
        # Wait until it's time to query again...
        time.sleep(interval)

except KeyboardInterrupt:
    pass
I can now test my script to make sure it’s logging data for me usingsudo python sensor_data_logger.py
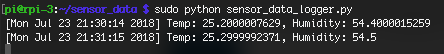
Back on the NUC, using the influx CLI again, I can query the data collected:
use sensor_data
select * from "rpi-dht22"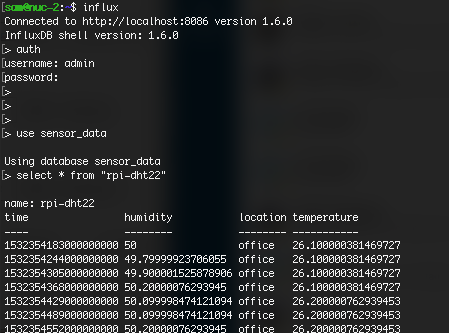
Feeling more than a little pleased with myself (I will create a service to run my script at a later date), I move on to installing Grafana. Similarly to the InfluxDB install, I add the repository, trust the public key and update and install using apt:
echo "deb https://packagecloud.io/grafana/stable/debian/ stretch main" | sudo tee /etc/apt/sources.list.d/grafana.list
curl https://packagecloud.io/gpg.key | sudo apt-key add -
sudo apt-get update
sudo apt-get install grafana
sudo systemctl start grafana-server
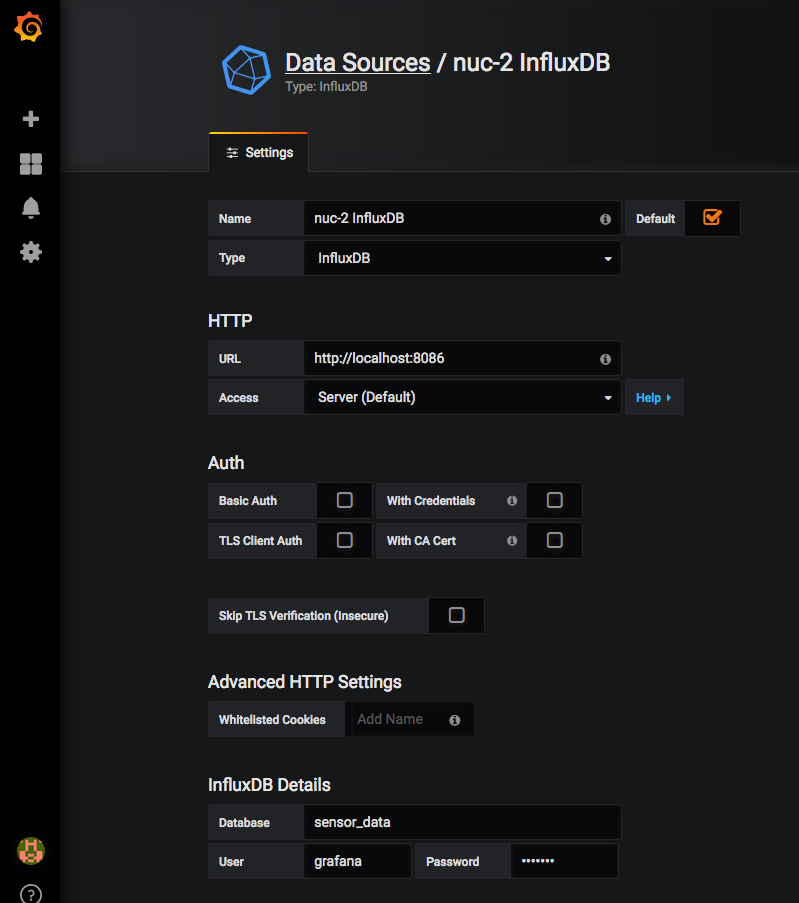
sudo systemctl enable grafana-serverTo configure Grafana, I opened a new browser window to my NUC on port 3000, logged in with the default admin password (admin) and ran through the setup wizard. Adding a data source I selected InfluxDB, left the defaults for everything except the Database Name, User and Password, for which I used the “grafana” read only account created earlier.
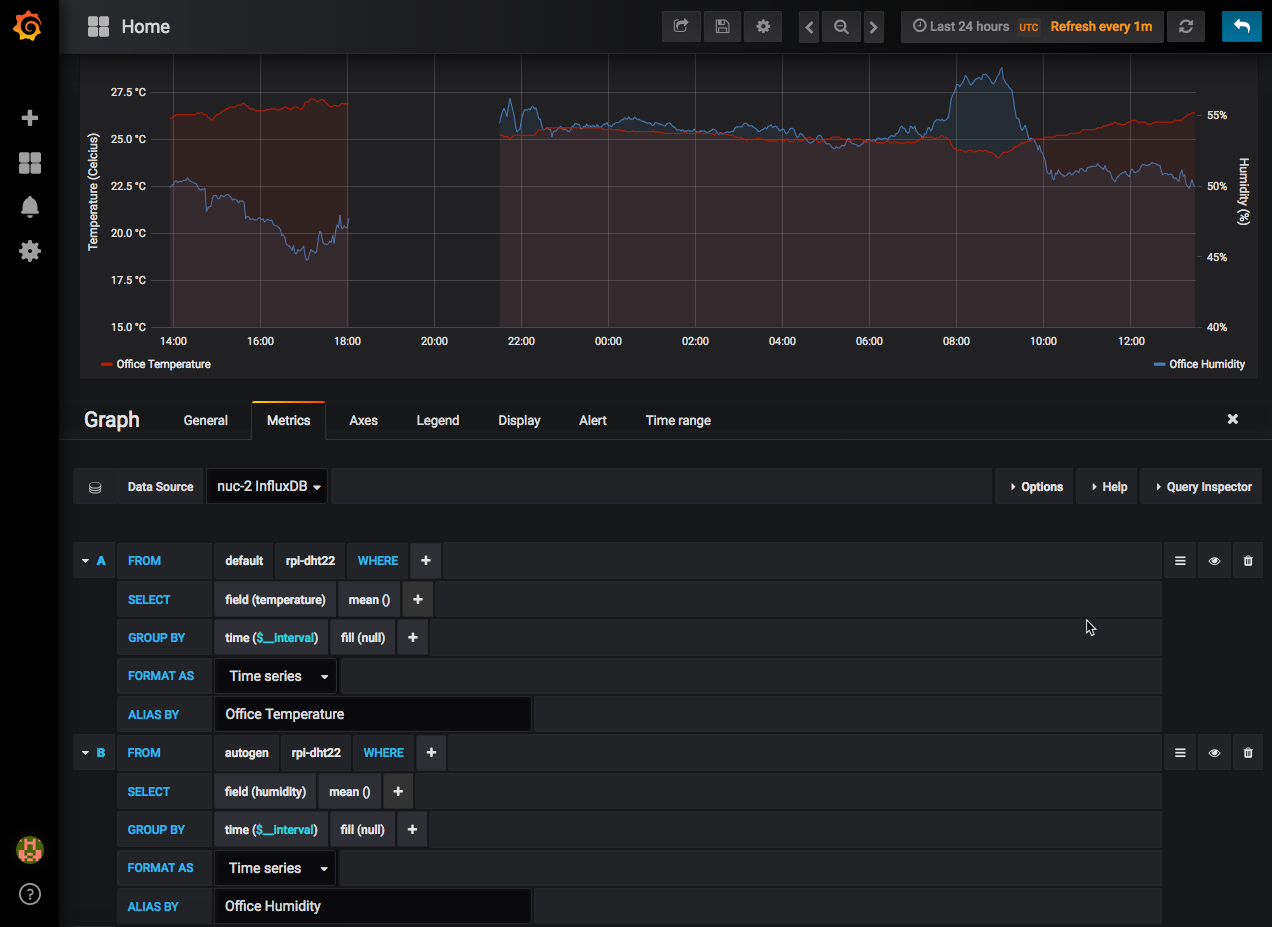
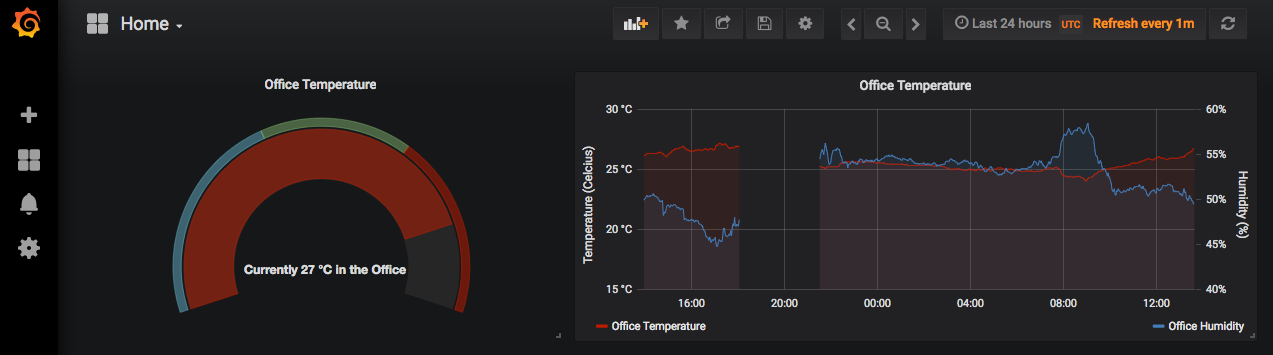
With the data source now populating, and imported into Grafana, I created a new dashboard “Home” and added a Chart panel. With some tweaking and adjusting the settings, it looks like this, displaying the last 24h temperature and humidity.
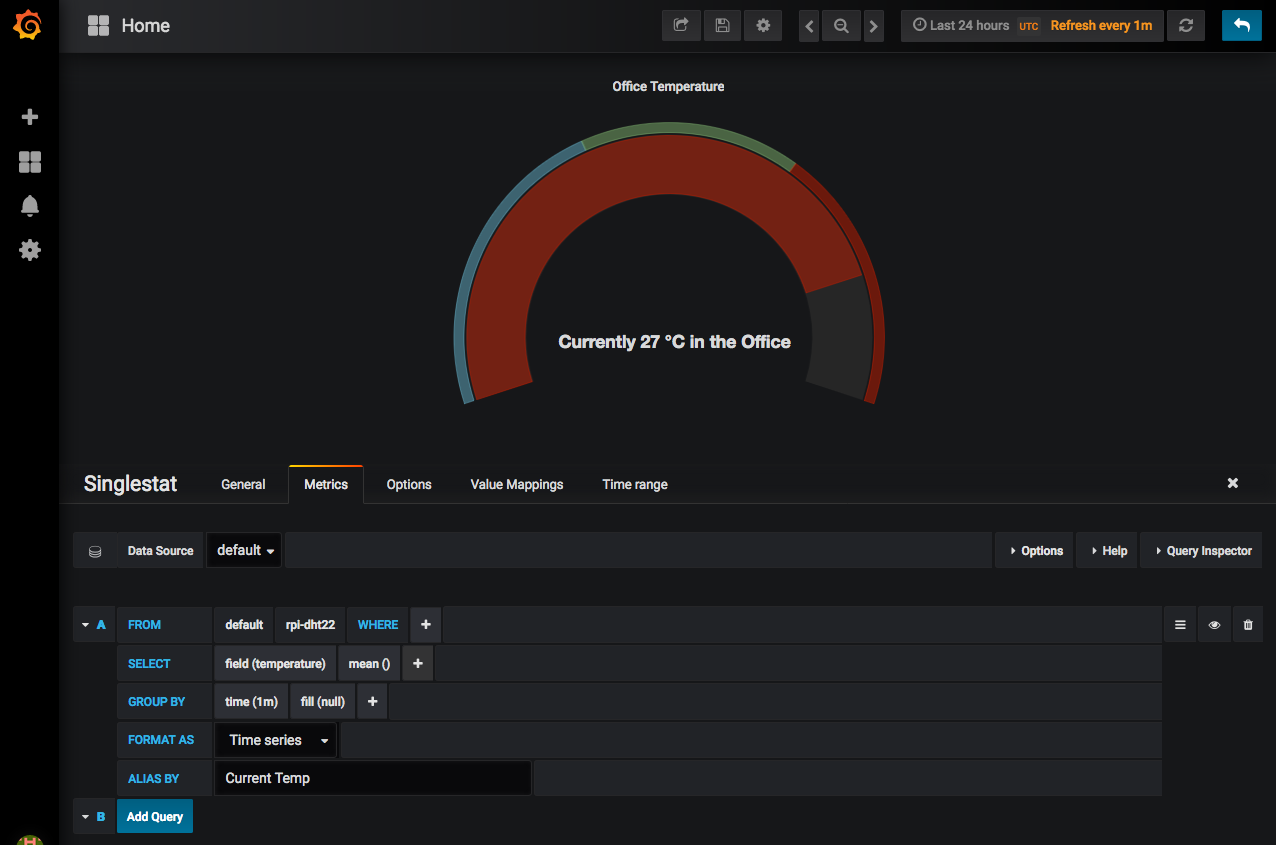
Next, using the same data, but displaying it using the “SingleStat” panel I created a Gauge to display the current temperature, with an “ideal” scale around it. Blue is too cold, green just right, and red too warm. As you can see, it’s a bit warm in here today!
Bringing these both together in a dashboard gives me a nice view of the data.
My next steps will be to run the python script as a service (rather than a nohup’d script!) for resilience. I will buy a second DHT22 sensor to put on another Raspberry Pi (another vExpert gift from 2013, thank you Simplivity) to begin monitoring my Garage as intended. I also have a python library to pull in temperature data from my air conditioning units. As a future stretch goal, I want to monitor the electricity generated from my solar panels, and maybe crack the data out of my gas and electric provider. But for now, I’m pleased with my dashboard, and I’ve learned a bit about Python, InfluxDB and Grafana on the way!